Virtual society:model
| Virtual society | Virus spread | Literature | Version | |
|---|---|
| Data | Model | Results |
hidden contents
!--
Contents
Basic Virtual Society and its development
We first define a basic virtual society (BVS) as a set of populated and geo-referenced (located) households. Populated means that the households comprise the whole population of the country with its age and gender distributions in each voivodeship (data obtained from NCB). In other words, every individual from a population, described by its age and gender, is assigned to a particular household. Also, each household in the BVS has a geographic location assigned to it, or in other words, it is located. A schematic workflow for the generation of a basic virtual society is presented in Figure 1.
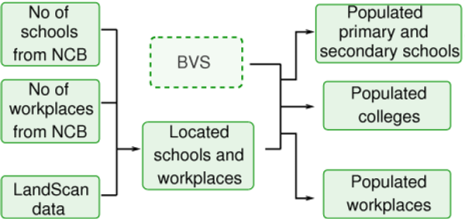
Once a basic virtual society is created, any additional infrastructural network can be developed using the same general workflow. First, specific outposts have to be located (in the lack of the geo-location data as in e.g. USA virtual society models of Ferguson et al[1] or Stroud et al[2] ). Then, agents have to be assigned to a particular outpost. Figure 2 presents a schematic workflow for the addition of schools and workplaces to the BVS.

A particular implementation of the general workflow from Figure 2 may differ in a way an agent assignment to particular outposts is done. Indeed, in these studies, this was done separately for primary and secondary schools, colleges, and workplaces. Typically, if the statistical data on geo-location and size of schools or workplaces are available, gravity models are used[1][2] for the agent assignment to the appropriate outposts. Otherwise, if the available or used data constrains only the total number of schools, workplaces (which is the case in this work) or the average school size, heuristic free-selection algorithms are implemented, e.g. allowing for the random selection of the school for each child under certain constraints [3][1][4].
Allocation of agents to the households
The age and gender distribution in every household is obviously not random, but rather it should reflect some possible relationships, the "generation gap". In order to reproduce realistic households populations, we propose a stochastic algorithm supporting a decision-making, necessary to place an agent in a household. We call this step a game, due to the conceptual proximity of this method to the methods commonly used within a framework of the game theory.
First, agents were divided into men and women and subdivided into 16 smaller populations appropriate for polish voivodeships. Then, for each gender and each voivodeship, agents were simply divided into age groups according to age distribution of the given gender in the given voivodeship (these data were acquired from Polish NCB). Subsequently, agents were distributed among households separately in each voivodeship.TO BE CHECKED!!!.
Second, the size of household was chosen randomly from the distribution of household sizes in Poland (data taken from NCB).TO BE CHECKED!!!
To assign a software agent (of a given age and gender) to a household, the following rules were devised:
- Children (age 0-24) and parents were treated separately.
- Children were not placed in empty households.
- For each member in the household (if existing), the probability of attraction (denoted as
 ) or competition (
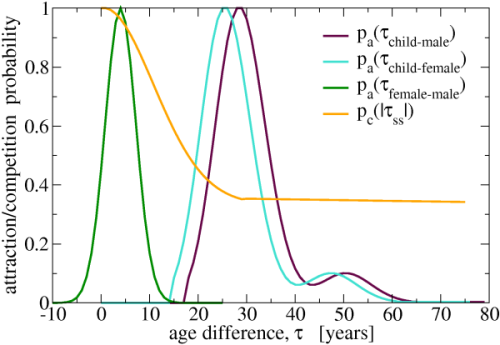
 ) between given member and the agent to be placed were calculated. The probabilities, shown in Figure 3, were chosen arbitrarily, and were dependent only on the age difference, τ, between a given household-member and the agent to be placed. To give an example, a child-aged agent was placed in a household only if there was already a parent-agent in this household, and only if this agent was old enough to be a parent of this particular child to be placed. There were 3 kinds of attraction probabilities, and one competition probability:
- the probability of an attraction between child and adult female,
 , where
  ; It was set to zero for the age difference less than 15 (to allow for "generation gap", that is, to ensure that mother is at least 15 years old). The highest pawas for age child-female age difference equal 26 - the number reported as the average age of a woman giving birth to her first child.
 - the probability of an attraction between child and adult male,
 , where
  ; It was set to zero for the age difference less than 18.
 - the probability of an attraction between adult female and adult male,
 , where
  ;
; - the probability of a competition between adults of the same gender,
 , where
  is the absolute age difference between the agent to be placed and a given household member of the same gender; Only the maximum
  and
and  from all obtained within a given household were used in further calculations.
- the probability of an attraction between child and adult female,
- The overall probability for acceptance of the agent in the given household was calculated using the following formula,
 , where optimal values for
  parameters were found to be 0.125, 0.9, and 0.7, respectively. The probability of placing an adult agent in an empty household equals 1.
Geo-location of the households
In order to locate a household taken from the set of households generated in the procedure described above, the following algorithm, based on the LandScan population density map, was applied: The number of inhabitants in each node of the LandScan map becomes this node's threshold value for the generated virtual population. Each node is filled with households' members by taking randomly a household from the subset of households corresponding to a given administrative unit (voivodeship in this case). Every time all household members are added to a given node. This continues while the total population in the node is below the threshold value from the LandScan map.
Allocation of agents to schools and workplaces
Primary and secondary schools
Primary and secondary education level, dedicated for children 7-12 and 13-15 years old, respectively, is compulsory in Poland, thus schools at these levels are quite abundant in Poland (see Table 3 in Data). In order to locate these types of schools, a LandScan density map was used as a weight matrix for a stochastic distribution. The total number of the schools in each commune were taken from NCB. The assignment of pupils to the schools was based on the age of an individual and on the distance from his/her household to the nearest educational unit. Agent of a primary or secondary school age was assigned to a randomly selected appropriate school within a distance radius of 7 km from his household location. If there was no appropriate school within such a radius, a given pupil was assigned to the nearest school located beyond that radius.
Colleges
Due to the fact that the education on the college level is not compulsory in Poland, there are significantly less colleges than lower level schools (see Table 3 in Data). Consequently, there are communes without any college. Thus the poviat region was selected as a basic regional unit. The following procedure was than used to assign pupils to colleges. First, each college was populated with 2/3 of college-aged agents from its surrounding area of 30km radius. Then, the rest 1/3 of these college-aged agents from this area were assigned to the nearest college within their poviat. One should note, that the LandScan data refer to the actual population density data, so e.g. LandScan considers pupils living in dormitories, whereas in the NCB database used here each pupil is a part of a separate household.
Workplaces
The probability of the assignment of the workplace to a given node is related to the population density. The number of the workplaces in each voivodeship were obtained from the NCB. The maximum single workplace size in Poland is 2992, mean workplace size is about 10 individuals and mean distance between worker household and workplace is 10.2 km. The discrepancy between the number of workplaces and the population in a given region gives the natural effect of a daily commutation to the large agglomerations. (HOW WERE AGENTS ASSIGNED? 10.2km is from NCB or from the model??)
Location of Rescue Service Units (RSU) - possible application of the virtual society model
The location of the Rescue Service Units (RSU), does not pertain to a reconstruction of a real social topology process, but constitutes an attempt to construct an efficient tool for a predictive analysis of a relation between household locations and assumed topography of any rescue service systems. The RSUs are generalized, and can be substituted by any type of rescue services: voluntary fire brigades, medical services, epidemiological rescue units, etc.
The distribution of the RSUs was performed for each commune separately. Starting from one RSU, up to twenty RSUs were placed one by one in each commune. The probability of the location of any subsequent RSU in a given node on a grid was scaled by the LandScan population density map. Additionally, this procedure was under constraints imposed on the minimal pairwise distance between RSUs, which was set to 2 km.
Because we are interested in the general properties of Polish communes topology network, for each commmune we carried out the calculations yielding a dependency of the mean distance from a household to a RSU on the number of located rescue units. In such a way, it is possible to determine an optimal saturation with rescue units, comparing benefits and costs of establishing and funding of a new unit.
References
- ↑ 1.0 1.1 1.2 FERGUSON N M, D. A. T. Cummings, C. Fraser, J. C. Cajka, P. C. Cooley, and D. S. Burke, Strategies for mitigating an influenza pandemic, Nature, 442 (2006), pp. 448-452
- ↑ 2.0 2.1 STROUD P, Del Valle S, Sydoriak S, Riese J and Mniszewski S (2007). Spatial Dynamics of Pandemic Influenza in a Massive Artificial Society,Journal of Artificial Societies and Social Simulation 10(4)9
- ↑ FERGUSON N M, D. Cummings, S. Cauchemez, C. Fraser, S. Riley, A. Meeyai, S. Iamsirithaworn, and D. Burke, Strategies for containing an emerging influenza pandemic in Southeast Asia, Nature, 437 (2005), pp. 209-214
- ↑ GERMANN T C, K. Kadau, I. Longini, and C. Macken, Mitigation strategies for pandemic influenza in the United States, Proc. Nat. Acad. Sci., 103 (2006), pp.5935-5940
-->

