Difference between revisions of "Virtual society:results"
(→Basic Virtual Society - population and location of households) |
(→Basic Virtual Society - population and location of households) |
||
| Line 15: | Line 15: | ||
[[Image:households4_color.png |frame|left| '''Fig.1c''' ]] | [[Image:households4_color.png |frame|left| '''Fig.1c''' ]] | ||
[[Image:households5_color.png |frame|right|'''Fig.1d''']] | [[Image:households5_color.png |frame|right|'''Fig.1d''']] | ||
| + | |||
| + | |||
| + | Comparison of real and virtual population densities is presented in Figures 2a,b. | ||
| + | |||
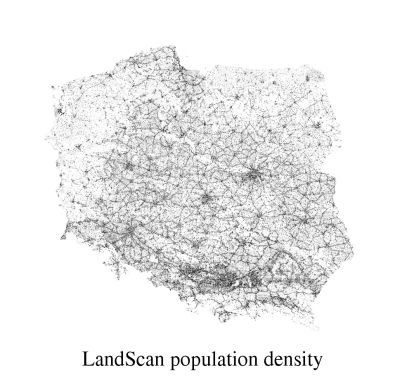
| + | [[Image:gosp_bw_cap.png |frame|left| '''Fig.2a''': Visual comparison of real population density in Poland (from the LandScan data), and virtual population density represented by density of households. Both data sets were created with 1 km2 resolution.]] | ||
| + | [[Image:ludnosc_pl_bw_cap.png |frame|right| '''Fig.2b''' ]] | ||
| + | |||
| + | Both figures show smaller population density in the NW and NE parts of the country, very high population density in the central-southern region of the country, and in some small concentrated areas corresponding to bigger agglomerations. The biggest conurbation areas are that of the capital city in the central-eastern part of the country, and a highly populated, and industrialized areas in the South. These are the most characteristic features of population density in Poland, and they are accurately well reproduced by our virtual society modeling simulations. | ||
== Distance to institution statistics == | == Distance to institution statistics == | ||
Revision as of 17:35, 31 October 2008
| Virtual society | Virus spread | Literature | Version | |
|---|---|
| Data | Model | Results |
We are reporting here some selected results describing properties of our Basic Virtual Society model. In such a system various ranges of quantitative analysis can be considered. However, we focus here on the features essential for ongoing epidemiological and transportation studies, as well as on the planned future investigations. Since the methods used for recreation of a given social nodes, e.g. schools and workplaces are in principle similar, we limit the description here only to one selected type of network structure.
Basic Virtual Society - population and location of households
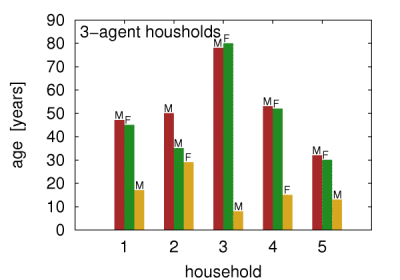
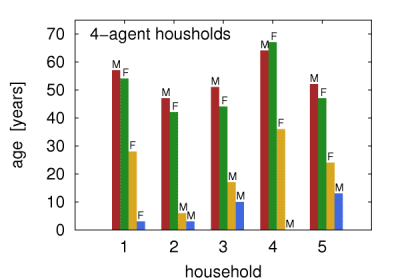
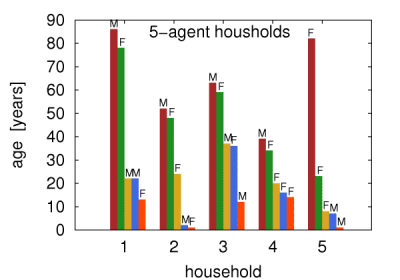
The obtained population of households reproduced the actual statistics obtained from the NCB. In particular, the number of inhabitants per km2 differs by less than 20 individuals from the values obtained from LandScan, and the size distribution of the households, the distribution of the age difference in couples/parents, the distribution of children number in households, and the distribution of the parents' age are all also well reproduced. Example 2,3,4, and 5-agent households are presented in Figures 1a-d.
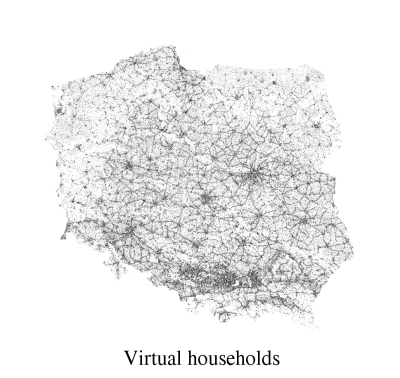
Comparison of real and virtual population densities is presented in Figures 2a,b.
Both figures show smaller population density in the NW and NE parts of the country, very high population density in the central-southern region of the country, and in some small concentrated areas corresponding to bigger agglomerations. The biggest conurbation areas are that of the capital city in the central-eastern part of the country, and a highly populated, and industrialized areas in the South. These are the most characteristic features of population density in Poland, and they are accurately well reproduced by our virtual society modeling simulations.

