Epidemics:guineapigs:results
| Society epidemics | Guinea pigs epidemics | Virus genetic evolution |
|---|---|---|
| Data | Model | Results | ||
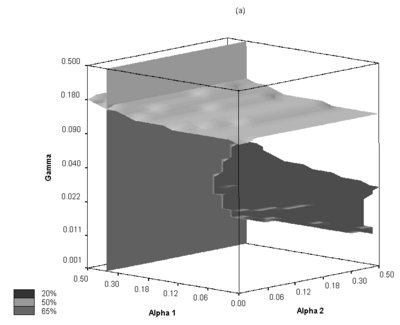
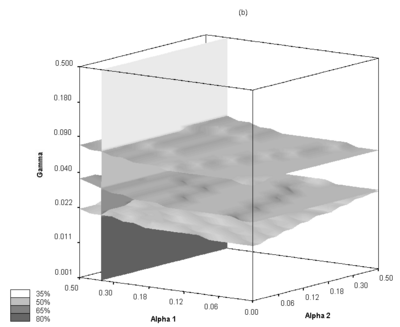
The obtained classification of experimental points in the parameter space is shown graphically in Figure 2.
Fig. 2: Classification of the parameter sets for (a) 20 C and (b) 5 C and (b) 5 C. For both temperatures, each humidity value sets a single compact area in the parameter space. The curved surfaces are boundaries between those areas; the respective humidity values are indicated by the color of the appropriate region of the vertical slice surface. The dark surface on (a) is drawn between the 20% and 65% areas C. For both temperatures, each humidity value sets a single compact area in the parameter space. The curved surfaces are boundaries between those areas; the respective humidity values are indicated by the color of the appropriate region of the vertical slice surface. The dark surface on (a) is drawn between the 20% and 65% areas
| |
The most striking feature is that neither of the parameter sets has been classified to 35% humidity for 20 C (the lack of 80% points for 20
 C is due to lack of the corresponding virus transmission, and of 20% points for 5
 C, of an appropriate data, respectively). Also the points belonging to 20% humidity lie only in a quite narrow range of high, and rather unexpected,
  values. We consider the occurrence of late infections in the corresponding experiments, together with the lack of infections on intermediate days, to be a possible cause of this behavior. Indeed, in our model such a situation is most similar to the distributions provided by surprisingly high values of
  . But this could never be typical because the infection probability is always a decreasing function of time, at least from the 3rd day. However, during Monte Carlo simulations, it is possible sometimes to obtain results that display this feature, even for quite reasonable parameters. Due to the experimental data set limitations, involving a rather small number of animals, it is not easy to determine whether those late infections are simply fluctuations, or rather a symptom of a certain phenomenon the model does not yet take into consideration.
Another striking feature of the classification for 20 C is the fact that the 50% humidity area is placed uppermost, above the areas representing 20% and 65% humidity. This is not consistent with the above-mentioned pattern of transmission dependency on relative humidity that was observed in the experimental results. Indeed, there was a local minimum of transmission observed at this humidity value, and therefore we would rather expect
  values in corresponding parameter sets to be smaller, not larger than the rest. This divergence is probably due to the extreme limitation of available data—as the virus transmission under these conditions was at a low level, only two infection cases occurred. This resulted in a very small, unrealistic standard deviation for the distribution of infection days. Thus, the distance between the simulation results for parameters expected to be relevant and the corresponding experimental result was much greater than it should be and exceeded the distance to the closest improper condition set. On the other hand, a small
  value corresponds to the situation that occurs in the model when
  is very high—nearly all pigs become infected on the 1st day. This might be a possible explanation why the parameter sets with high
  values have been classified to this humidity level conditions.
For 5 C the least distances (with all experimental points included) appear for the four sets of
  and
and  values shown in Table 4.
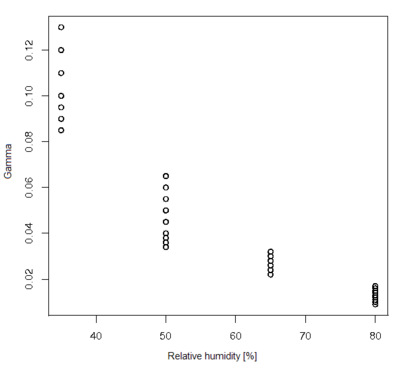
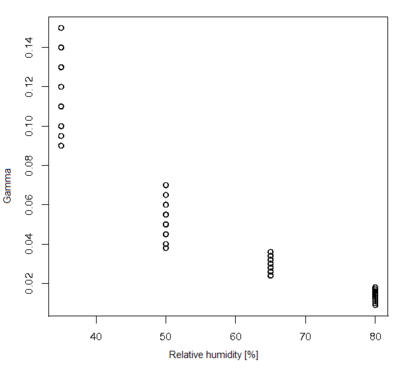
Possible values of
  for particular humidity levels at this temperature, provided those values of alphas, are shown in Figure 3. They seem to be consistent with the experimental results of Lowen et al.[1]

|
0.35 | 0.40 | 0.45 | 0.50 |
|---|---|---|---|---|

|
0.00 | 0.00 | 0.02 | 0.02 |
Fig. 3: Gamma vs. humidity for 5 C and ( C and ( , ,  ) equal (0.35, 0) and (0.45, 0.02) respectively. Only the points for which the distance is not greater than 0.8 are shown ) equal (0.35, 0) and (0.45, 0.02) respectively. Only the points for which the distance is not greater than 0.8 are shown
| |
For 20 C the minimal distances (of about 0.2) to the 65% humidity experimental result occur, with the above alphas, for
  values 0.04—0.045. This is the only conclusion that appears reasonable since the experimental data for other humidity values are probably distorted by statistical fluctuations, arising from the insufficient number of cases. The V-space distances between any point classified to 20% or 50% humidity and the appropriate experimental result are greater than most of the distances between particular experimental results, indicating that the classification for this temperature is not satisfactory. Due to the sparseness of experimental data, it would be interesting to search for another metric that does not rely on the distribution of the days on which infection occurred. Or, possibly, to calibrate our simulation model with a significantly larger experimental data set. Nevertheless, we consider the correlation between experimental and simulation results to be sufficient for the purpose of using transmissibility values obtained from this simple model as one of the inputs for intended large-scale epidemiological studies in the near future.
References
- ↑ Lowen A C, Mubareka S, Steel J, Palese P, Influenza Virus Transmission Is Dependent on Relative Humidity and Temperature, PLoS Pathogens 3(10), 2007, p151


